

August 26, 2024
Understanding the Math Behind Business Process Fabric™
Business transformation is no easy feat. Despite the best intentions and efforts, 70% of such initiatives fail to deliver the desired outcomes. The question is—why? The answer often lies in the lack of a process-centric approach. To succeed, organizations must have a deep understanding of their current processes and a clear vision of the future state they wish to achieve. Let’s dive deep into this!
Overview
In the previous blog, we discussed what Business Process Fabric™ is and how to implement this model to enable seamless end-to-end transformation from any legacy system to SAP cloud, setting the stage for scalable, future growth. This blog explores the mathematical logic that underpins the Business Process Fabric™, shedding light on how a data-driven, process-focused approach can significantly increase the chances of a successful business transformation.
Why 70% of Business Transformations Fail
At the core of understanding transformation failures is data. Over the last 20 years, we’ve analyzed vast amounts of data, uncovering key factors that influence the success or failure of business transformations. By building a web scraper on our custom AI model, we gathered data on these factors from the web specifically focusing on relevant and reliable publications, consulting blogs, analyst reports, and journals, resulting in a matrix with over a terabyte of information. This analysis reveals a significant insight: “The lack of business process visibility” is often at the root of transformation failures. The Correlation Matrix report shows how closely this is related to other factors impacting a digital transformation.

Click on the infographic to zoom and pan
Enabling the Business Process Fabric™ with SAP Solutions
SAP Signavio:
- The SAP Signavio Process Transformation Suite offers a comprehensive set of tools for process mining, modeling, analysis, and optimization. It supports real-time collaboration and fosters a process-aware culture within your organization, driving sustainable and intelligent business transformation.
SAP LeanIX:
- SAP LeanIX enhances enterprise architecture management by providing visibility into IT landscapes and facilitating informed decision-making. It integrates seamlessly with SAP Signavio to align business processes with IT strategies, ensuring a cohesive transformation journey.
SAP Datasphere:
- SAP Datasphere revolutionizes data access and management by unifying diverse data sources into a coherent business model. It supports real-time data connectivity and preserves business context, enabling seamless data integration and analytics across the organization.
SAP Data Intelligence:
- This platform integrates, manages, and processes enterprise data holistically. It supports intelligent processes and decision-making by connecting and extracting insights from various data sources, enhancing data governance and compliance.
SAP WalkMe:
- SAP WalkMe is a digital adoption platform that guides users through complex workflows and applications, ensuring smooth transitions and maximizing the efficiency of new technology implementations. It enhances user experience and accelerates the adoption of digital tools.
Custom AI Large Language Models:
- Leveraging custom AI models, we provide advanced analytics, natural language processing, and predictive capabilities. These models enhance decision-making, automate routine tasks, and offer personalized insights, driving innovation and efficiency.
Insight!
Not sure where your systems stand for a transformation journey? Cognitus offers comprehensive business transformation services including assessment, strategic advisory, business process planning, implementation, and beyond! Get I touch with our experts today!
Our View of Business Architecture
An organization is a socio-economic entity that operates with the fundamental objective of creating value for society. It achieves this by integrating social, economic, and technological dimensions into its core activities. This holistic approach not only ensures sustainable profitability and growth but also aligns the organization’s goals with societal needs and aspirations. By fostering innovation, ethical practices, and community engagement, organizations contribute to the well-being and development of the societies in which they operate, thereby fulfilling their role as responsible corporate citizens.
Our view of business architecture stipulates that the probability of an organization’s ability to execute its mission (M) given its vision (V) is still valid at any point (T), can be mathematically represented by:
P(Mt+n|Vt+n) = ∑(Vst+n +Ct+n + Strt+n + Rt+n + Dst+n) ± ∑( St+n+Et+n+Tt+n)
where S, E, and T are the constraints or hyperparameters estimable but not controllable by the organization.
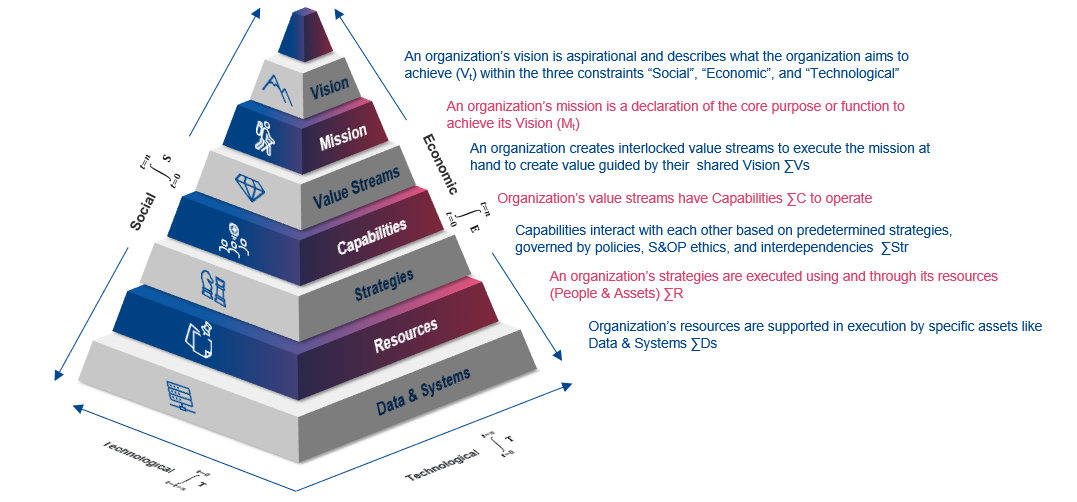
By adjusting controllable factors such as vision, strategy, and resources in response to predicted constraints, organizations can steer their transformation efforts towards success. The key lies in accurately predicting, prioritizing, and recommending changes to the business architecture that align with future needs.
The Math Behind the Business Process Fabric
Understanding the probability of an organization’s success in executing its mission (M) given its vision (V) is crucial. This probability, represented as P(Mt+n|Vt+n), is influenced by various factors, including the organization’s vision, strategy, resources, and constraints like time and external factors. The goal is to maintain this probability as close to 1 as possible, indicating a high likelihood of success.
As organizations try to ensure that this mission execution probability P(Mt|Vt) is as close to 1 (failure = 0 and success = 1) they adjust the controllable factors which can be mathematically represented by:
∑(Vst +Ct + Strt + Rt + Dst)
using the drivers predicted in the model using the constraints or hyper parameters:
∑( St+Et+Tt)
And so, while forecasting business transformation, the probability of an organization’s ability to execute its Mission given its Vision is still valid at any point t mathematically can be represented by:
P(Mt+n|Vt+n) = ∑(Vst+n +Ct+n + Strt+n + Rt+n + Dst+n) ± ∑( St+n+Et+n+Tt+n)
Where S, E, and T are the constraints or hyperparameters estimable but not controllable by the organization
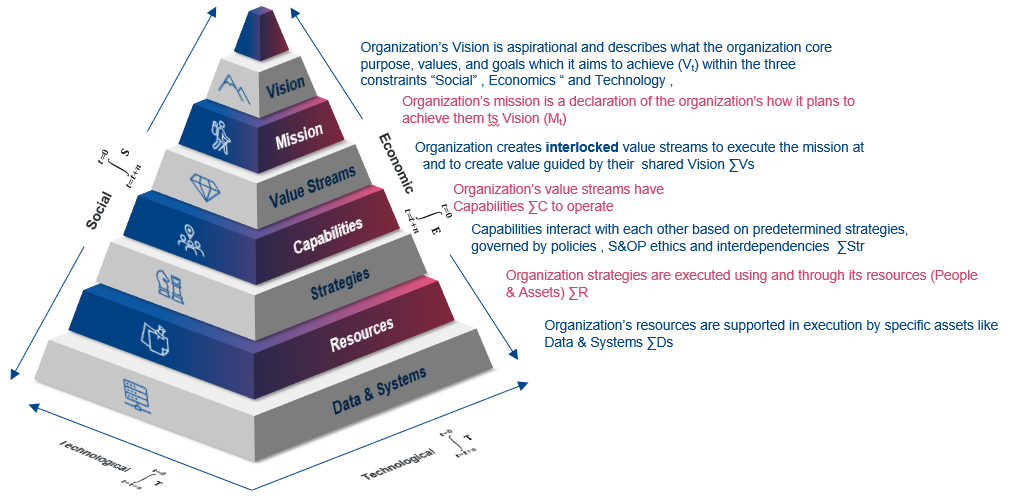
So, a transformation can be simply defined and measured as the organization’s journey from time t to t+n where n is a time in the future:
P(Mt|Vt) >> P(Mt+n|Vt+n)
By appropriately adjusting (using a MRDA* (monitoring / reporting / decision / action) framework ) the controllable levers (Vst +Ct + Strt + Rt + Dst) to reflect the impact of predicted hyperparameters to time t+ n ( St+n+Et+n+Tt+n) to get a new state for controllable variables (Vst+n +Ct+n + Strt+n + Rt+n+ Dst+n) to arrive at:
P(Mt+n|Vt+n ) = ∑(Vst+n +Ct+n + Strt+n + Rt+n+ Dst+n) ± ∑( St+n+Et+n+Tt+n)
or building this as an integration model. Where S, E, and T are the constraints or hyperparameters estimable but not controllable by the organization.
P(Mt+n|Vt+n ) = ∫tt+n P(Mt|Vt)
While maintaining the organization’s ability to ensure the probability of executing the mission (or modified mission) P(Mt+n|Vt+n) to the vision (or modified vision) to still tending to 1.
So, the key to success of a transformation is to ensure we know ∑(Vst +Ct + Strt + Rt + Dst) ± ∑( St+Et+Tt) current state of business architecture in detail and be able to predict, prioritize and recommend the future state of the business architecture
∑(Vst+n +Ct+n + Strt+n + Rt+n+ Dst+n) ± ∑( St+n+Et+n+Tt+n)
Orchestrating Transformation with Data-Driven Decision Making
Our transformation toolkit is designed to help organizational leaders orchestrate transformation activities—reporting, decision-making, action, and monitoring—through data-based decision-making. The framework includes real-time reporting capabilities, enabling leaders to stay informed and agile throughout the transformation process.
The mathematical model we’ve developed, though summarized here in a linear form, is built on complex, non-linear equations that account for the dynamic nature of business transformations. The integration of process-mined data, enterprise structures, and unstructured data through SAP Data Intelligence and BTP Open AI APIs allows us to build a network graphical model. This model serves as both a transformation recommendation engine and a predictor of success.
Conclusion
The results from training data have been promising, and as we continue to refine our approach, we remain committed to leveraging cutting-edge technology to drive successful business transformation for businesses across industries. By understanding the math behind business process fabric and using data-driven strategies, organizations can increase their chances of success, ensuring that their transformation efforts deliver the desired outcomes.